DK8KW Longwave Information
More Spectrogram Picture
Samples
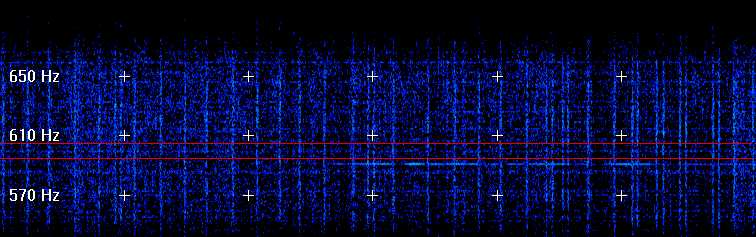
This is a picture of the Loran
lines at my location (about 200 km away from the cost). This may give you
an indication about the problems and Loran windows that other stations
living near a Loran stations might see (DF3LP
send me a spectrogram depicting the awful receiving situation he has, his
spectrogram looks like a zebra!).
The two yellow lines represent 137.695 kHz (lower line) and 137.705
kHz (upper line). A good window seems to be just above and below the double
line at 137.686 kHz.
These Loran lines here are from the station on the island of Sylt in
Northern Germany, how is the situation in other places (e.g. U.K.)? If
you have a picture of Loran lines from your point of view, send it to me,
I would like to put it here as an orientation guide.
In the Slow-CW window between 137.650 and 137.775 kHz tha I usually
monitor, I can detect the following Loran-lines. You might want to avoiv
those frequencies and better choose a frequency that is one or more Hertz
away from one of those lines so that people living nearby the cost still
can copy you:
|
137.655
|
kHz
|
|
137.660
|
kHz
|
|
137.671
|
kHz
|
|
137.674
|
kHz
|
|
137.687
|
kHz
|
|
137.700
|
kHz
|
|
137.714
|
kHz
|
|
137.715
|
kHz
|
|
137.727
|
kHz
|
|
137.734
|
kHz
|
|
137.747
|
kHz
|
|
137.760
|
kHz
|
|
137.768
|
kHz
|
|
137.774
|
kHz
|
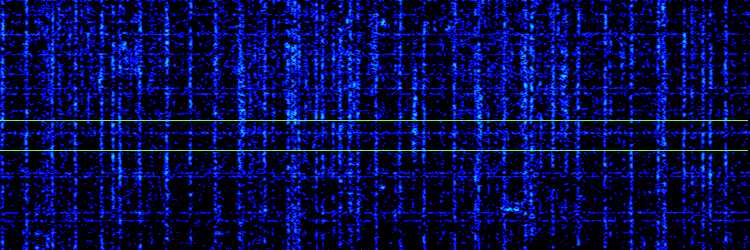
Here is a closer look at the range around 137.700 kHz:
 Please send comments & suggestions to:

copyright (c) 2001-2006 by dk8kw, all rights reversed